Getting Started with Hive
Welcome to Hive! This guide will walk you through everything you need to know to start using the platform effectively.
Prerequisites
Before you begin, ensure you have:
- A valid Hive license (or trial account)
- Modern web browser (Chrome, Firefox, Safari, or Edge)
- Internet connection
- (Optional) Docker installed for APHIDS CLI usage
New User?
If you don't have a Hive account yet, visit hive.darksidesecurity.io to sign up for a free trial.
Step 1: Access the Hive Platform
Web Access
- Navigate to your Hive instance:
- Hive Professional:
https://hive.darksidesecurity.io -
Hive Enterprise:
https://YourEnterpriseHere.darksidesecurity.io -
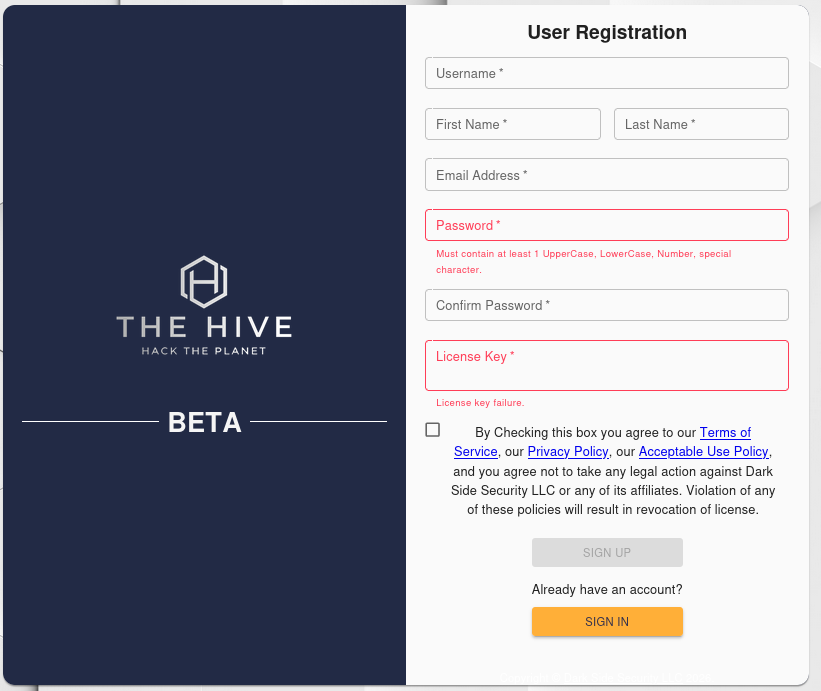
You'll be presented with the login screen, click Register to create a Hive User account
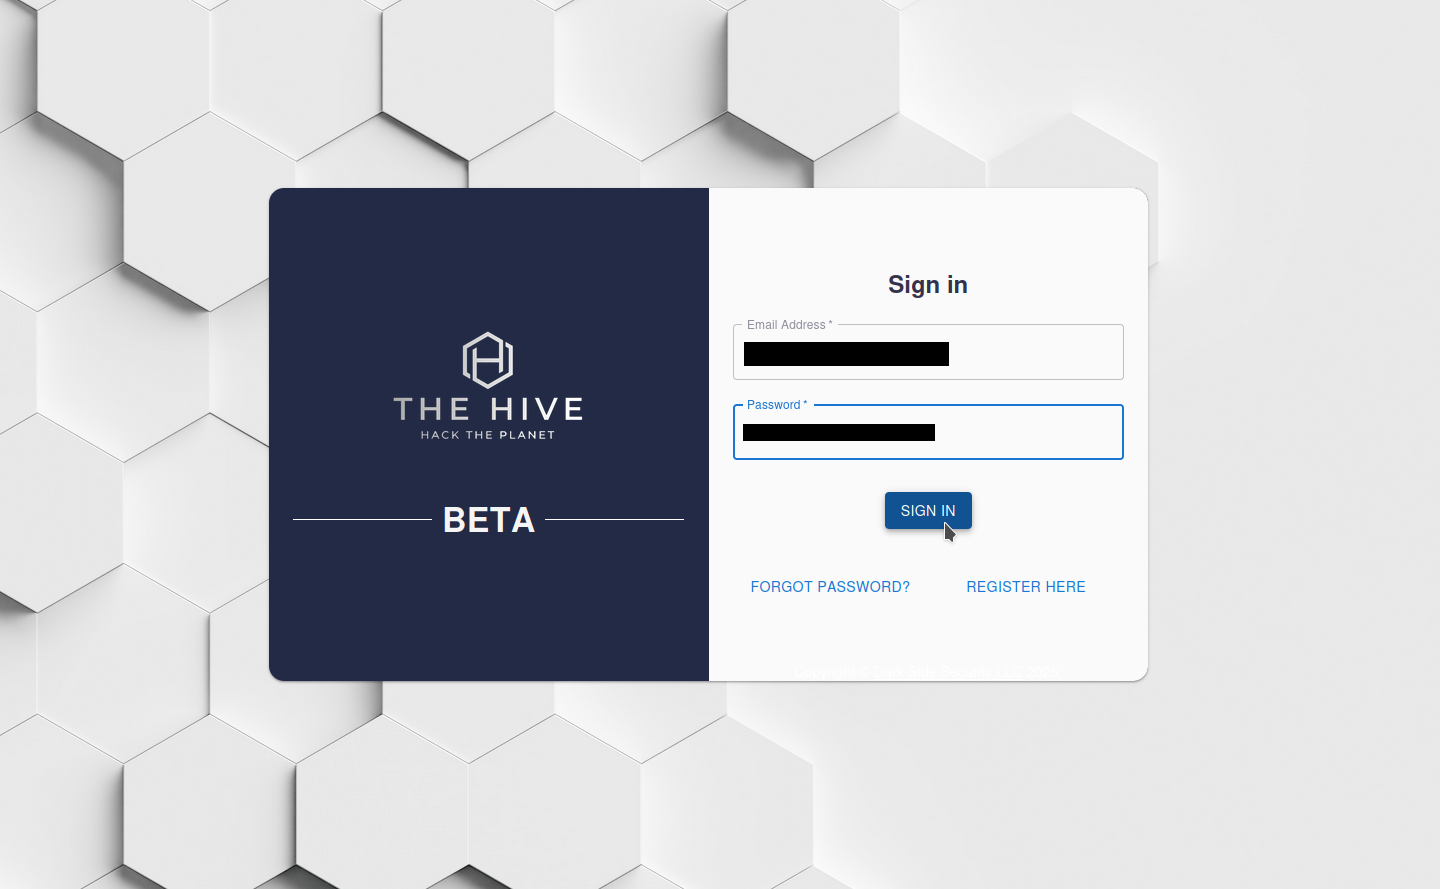
First Login
- Enter your credentials:
- Email: Your registered email address
-
Password: Your secure password
-
Click Sign In
-
(First time only) You may be prompted to:
- Verify your email address
- Accept terms of service
Step 2: Understand the Dashboard
After logging in, you'll see the Overview Dashboard. This is your command center for all security operations.
Dashboard
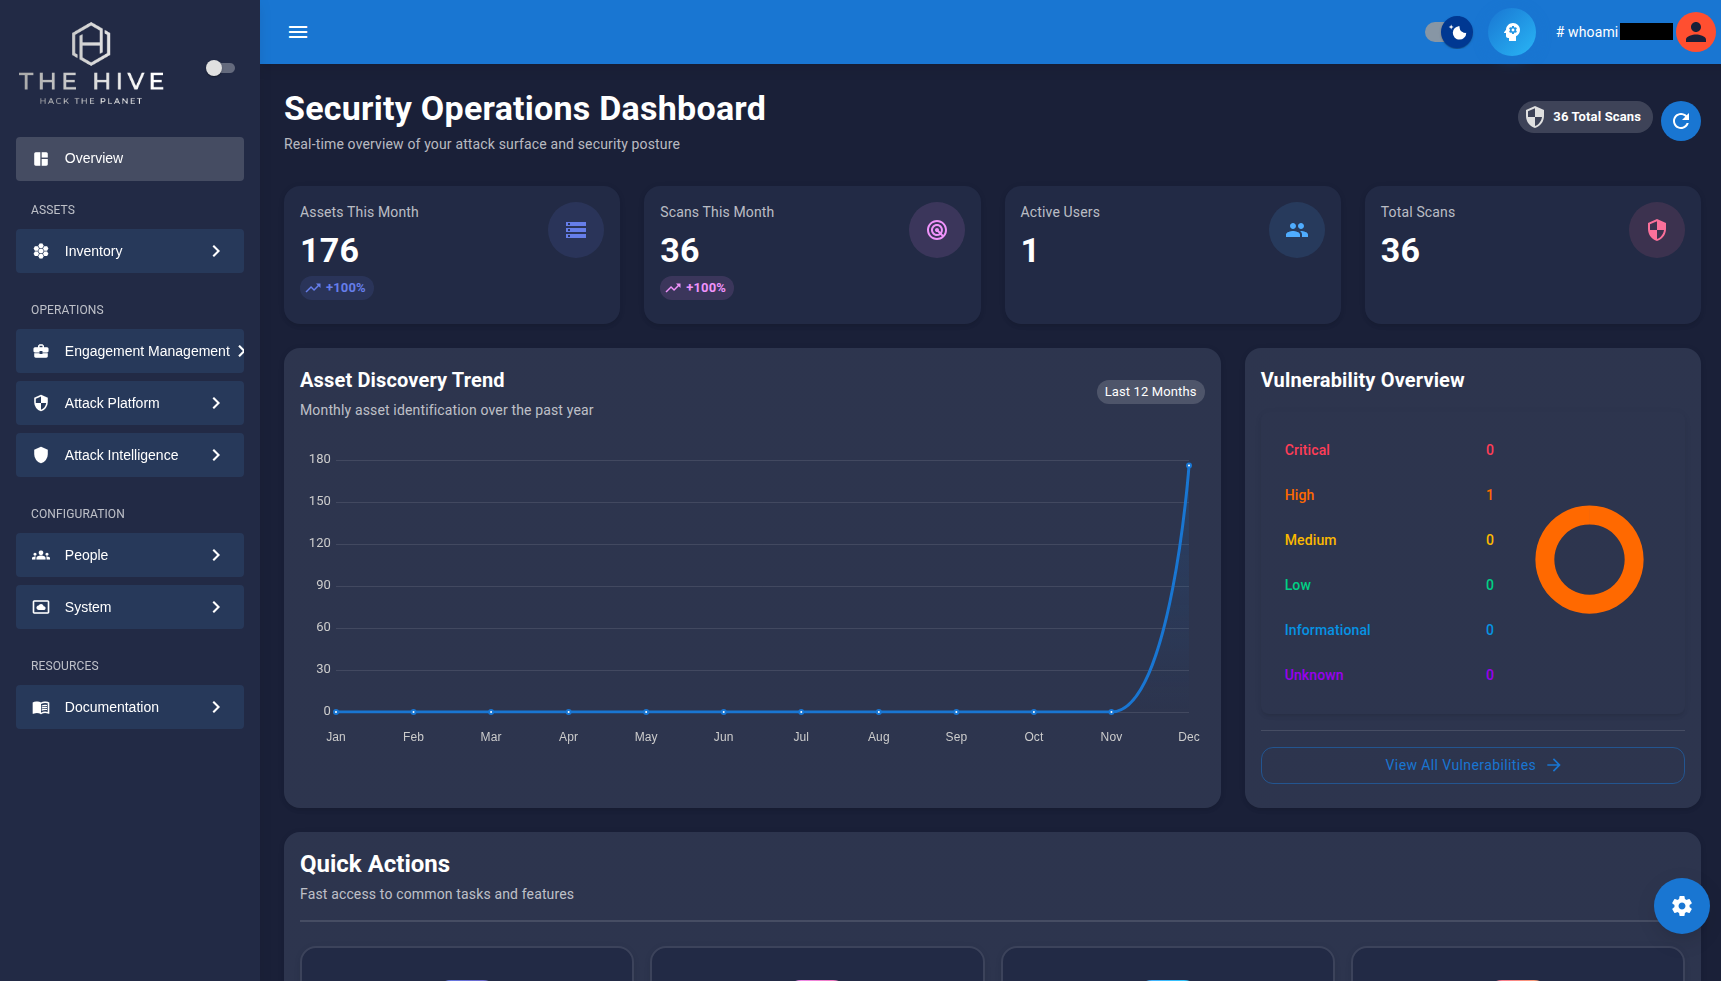
The dashboard is organized into several key sections:
Navigation Sidebar
Located on the left side, the navigation provides access to all platform features:
- Overview: Dashboard and metrics
- Assets: Inventory management
- All Assets
- URLs, Sites, Hosts, Ports, IPs
- DNS Records
- Applications & Metadata
- Attack Platform: Security testing strategies
- Runbooks
- Attack Trees
- Strategy Builder: Create custom testing workflows
- Automation Engine: Scan execution and monitoring
- Operations: Campaign and engagement management
- Intelligence: Vulnerabilities and findings
- Configuration: Users, groups, and settings
Step 3: Create Your First Organization
Organizations help you organize your security testing efforts, especially if you're managing multiple clients or projects.
Creating an Organization
- Navigate to Operations → Organizations in the sidebar
- Click the Create Organization button
- Fill in the organization details
- Click Create
Why Organizations?
Organizations serve as containers for campaigns and engagements, helping you keep client work separated and organized.
Step 4: Create Your First Campaign
Campaigns represent high-level security initiatives or projects.
Creating a Campaign
- Navigate to Operations → Campaigns
- Click Create Campaign
- Enter campaign details:
- Name: Campaign name (e.g., "Q1 2024 External Assessment")
- Organization: Select the organization you created
- Description: Campaign objectives and scope
- Start Date: When the campaign begins
- End Date: When the campaign concludes
- Click Create
Step 5: Create an Engagement
Engagements represent specific security testing activities within a campaign.
Creating an Engagement
- Navigate to Operations → Engagements
- Click Create Engagement
- Fill in engagement details
- Click Create
Step 6: Run Your First Scan
Now for the exciting part - let's run a security scan!
Option A: Using a Runbook (Recommended for Beginners)
Runbooks are pre-configured security testing workflows.
- Navigate to Attack Platform → Runbooks
- Browse available runbooks:
- Web Application Scan: Comprehensive web app testing
- Network Discovery: Port scanning and service enumeration
- Subdomain Enumeration: Discover subdomains
- SSL/TLS Analysis: Certificate and configuration testing
- Click on a runbook to view details
- Click Execute Runbook
- This will bring you to the Scan Executions Page
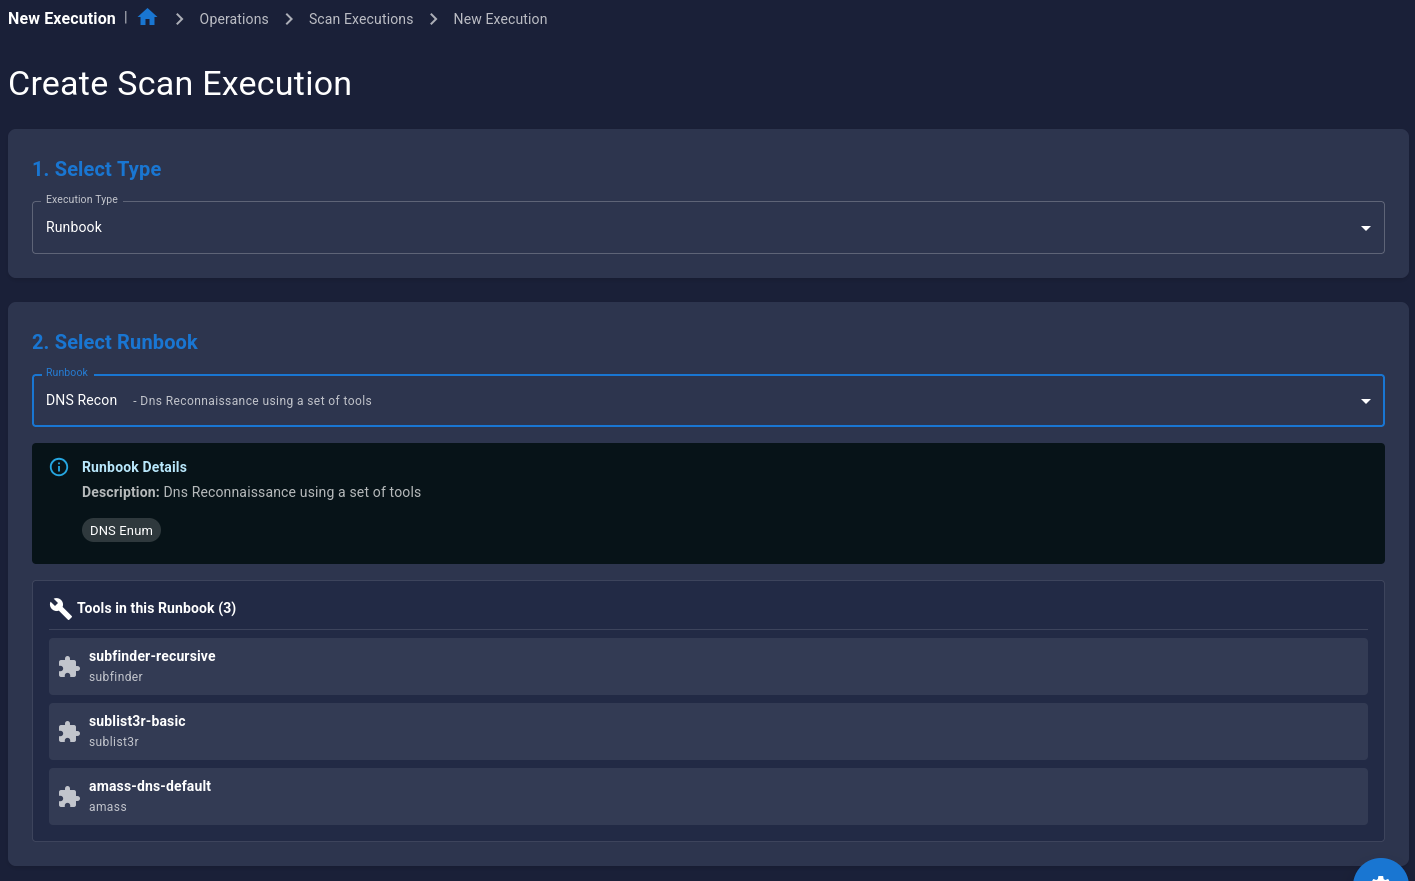
- Configure Scan Execution parameters:
- Target: Enter your target (URL, IP, or domain)
- Engagement: Select your engagement
- Options: Customize scan parameters (optional)
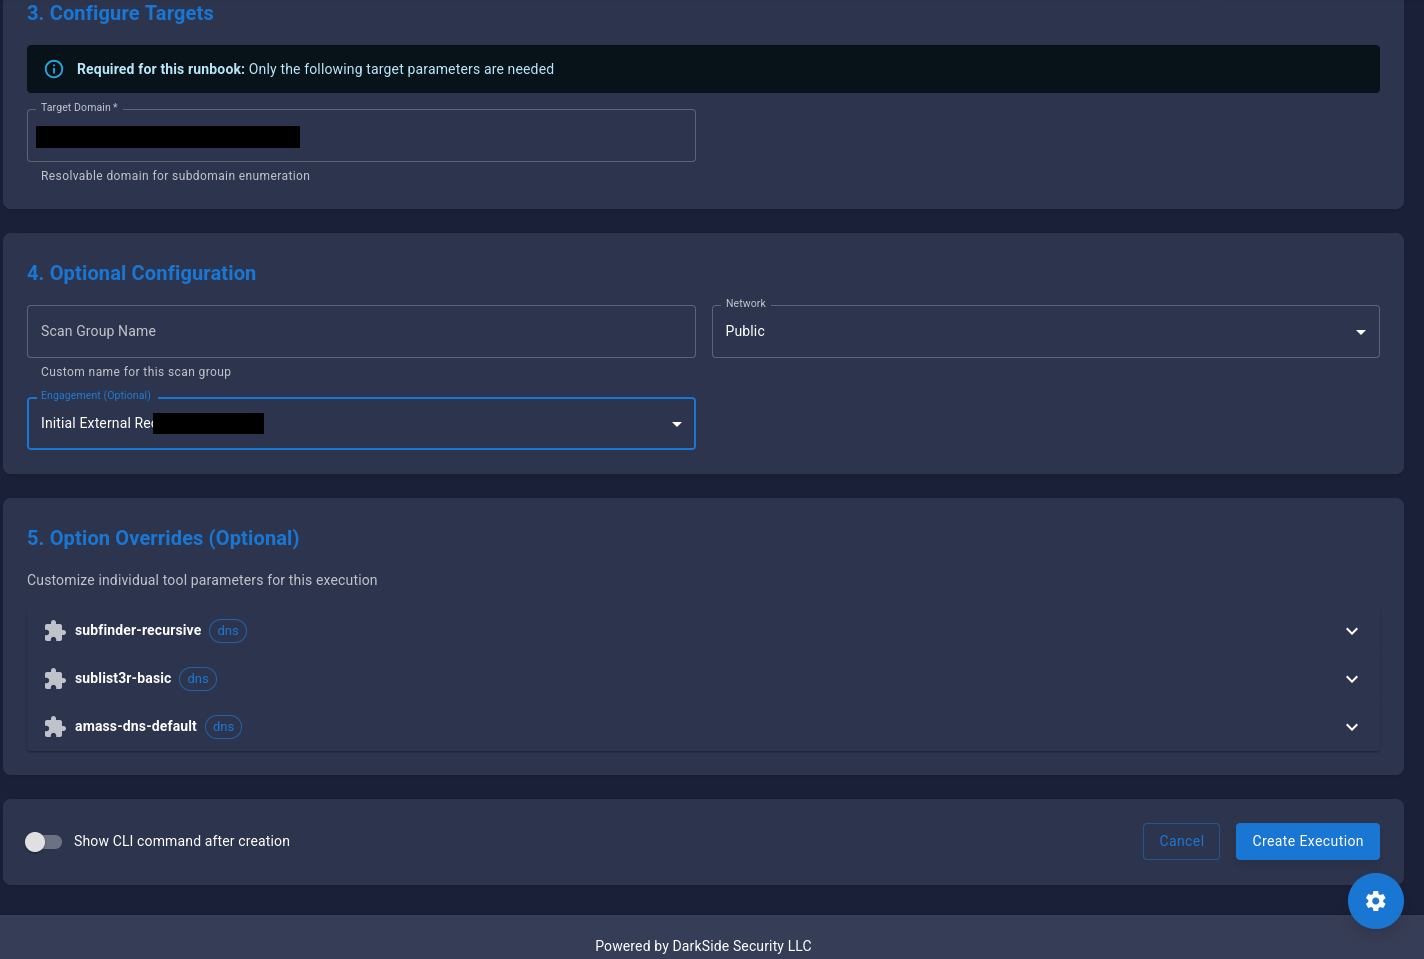
- Click Start Execution
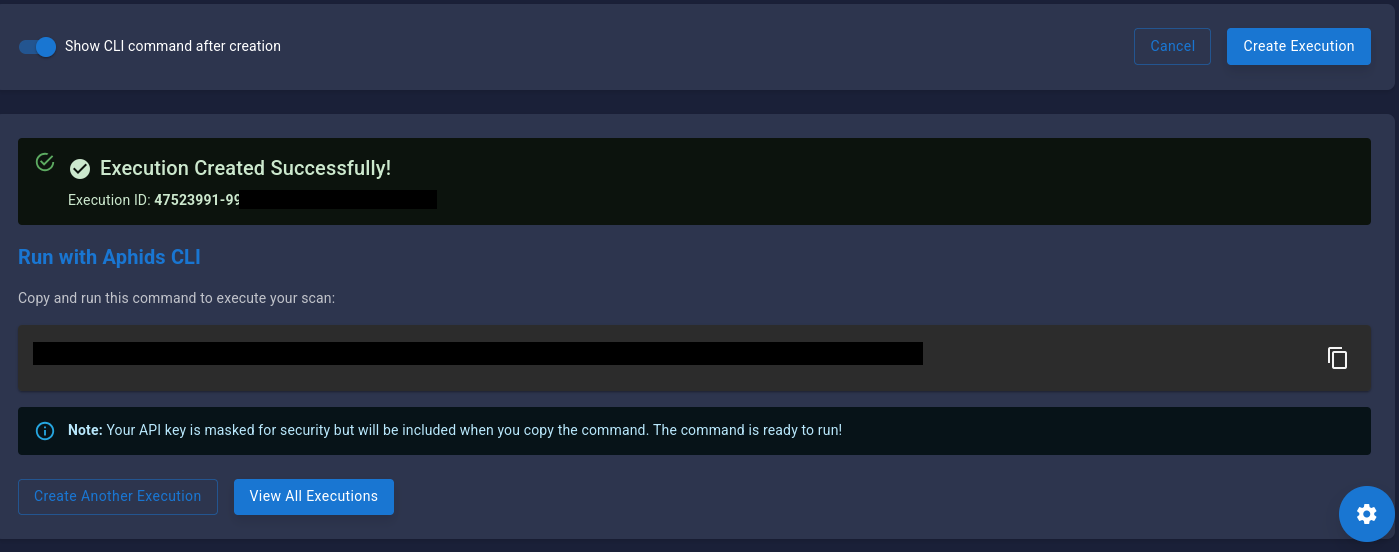
Option B: Using the APHIDS CLI
For command-line enthusiasts:
# Execute a runbook via CLI
aphids-cli \
  --api-key YOUR_API_KEY \
  --api-url https://api.hive.darksidesecurity.io \
  --runbook RUNBOOK_ID \
  --target-url https://example.com \
  --engagement ENGAGEMENT NAME
Get Your API Key
Navigate to Configuration → Settings → API Keys to retrieve/re-generate your API key.
Step 7: Monitor Scan Progress
Viewing Active Scans
- Navigate to Automation Engine → Scan Executions
- You'll see your scan listed with:
- Status: Running, Completed, or Failed
- Progress: Percentage complete
- Start Time: When the scan began
- Estimated Completion: When it will finish
Real-Time Monitoring
Click on a running scan to view:
- Module Progress: Which security tools are running
- Live Output: Real-time scan results
- Discovered Assets: Assets found so far
- Findings: Security issues discovered
Step 8: Review Results
Once your scan completes, it's time to analyze the results.
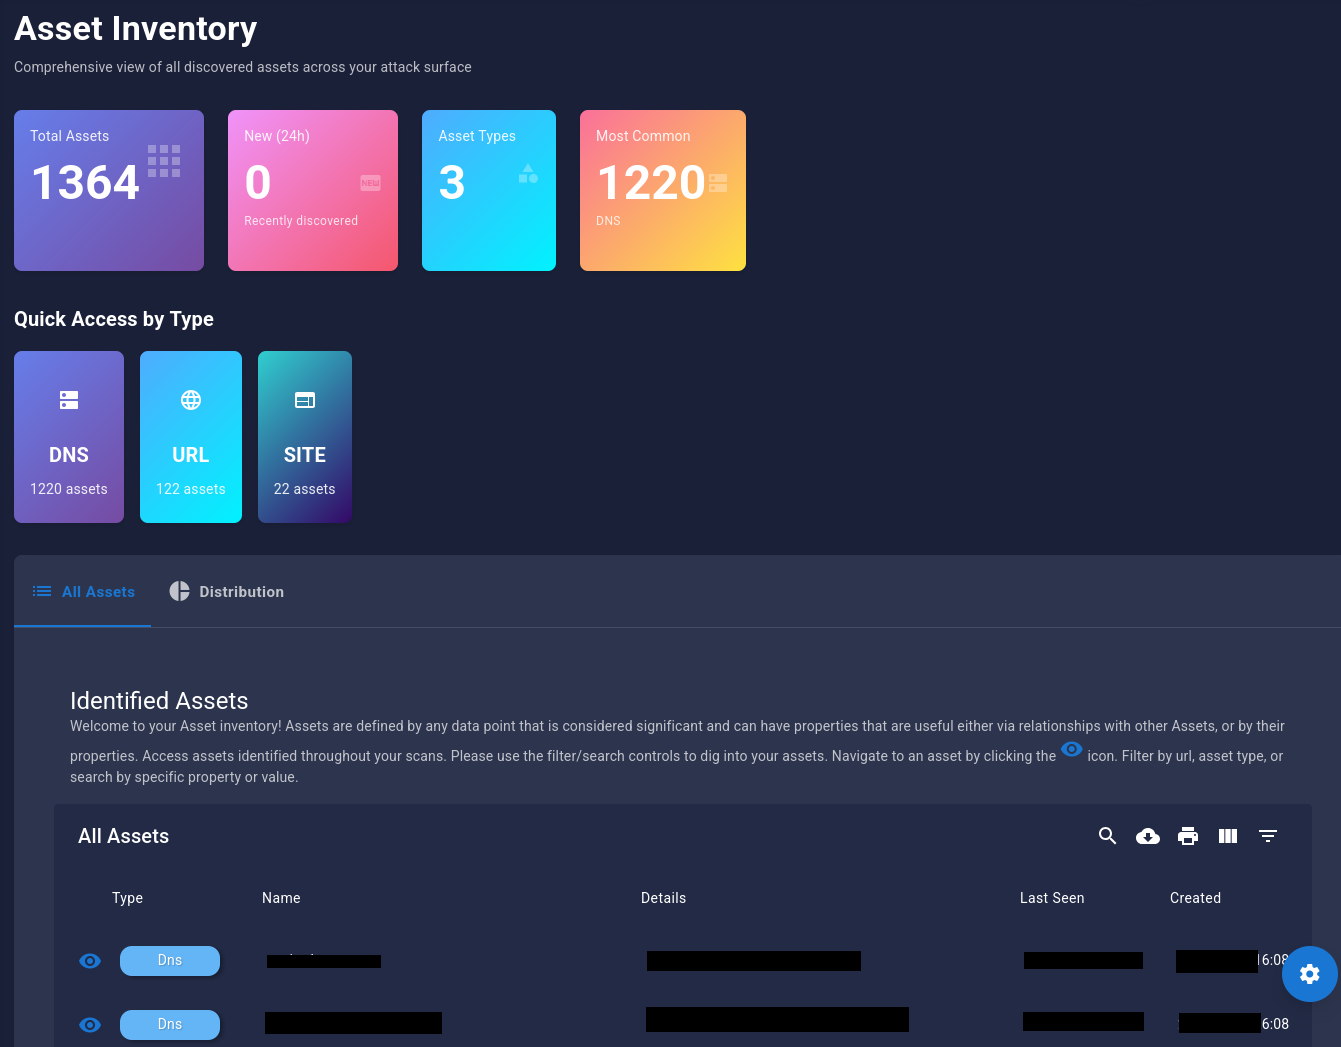
Viewing Discovered Assets
- Navigate to Assets → All
- You'll see all assets discovered during your scan:
- URLs
- Hosts
- IP Addresses
- Ports
- DNS Records
- Applications
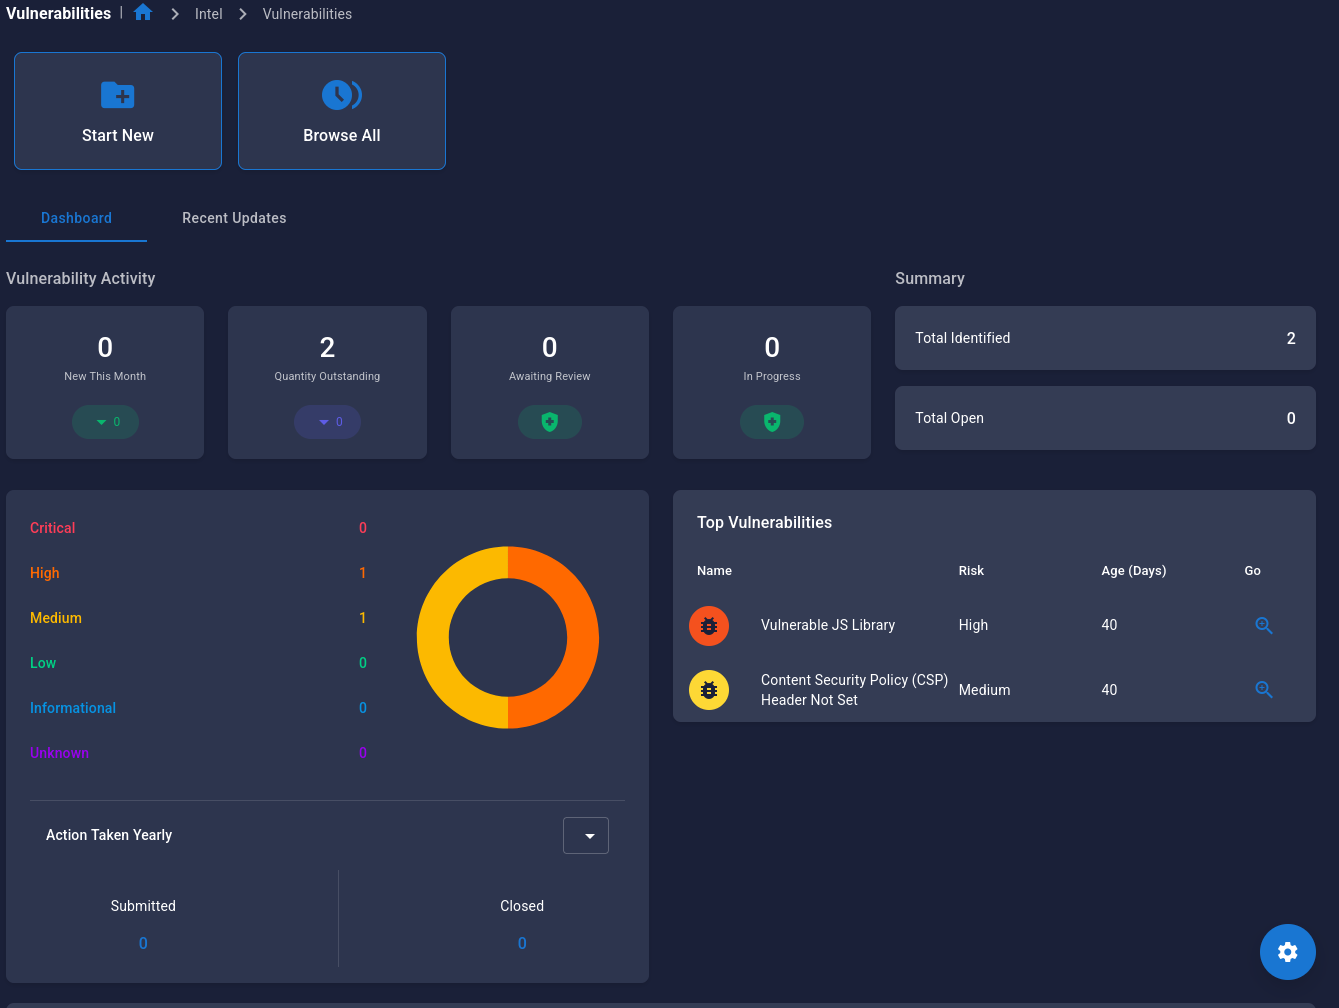
Analyzing Vulnerabilities
- Navigate to Attack Intelligence → Vulnerabilities
- Review vulnerabilities by:
- Severity: Critical, High, Medium, Low
- CVSS Score: Numerical risk rating
- Asset: Which asset is affected
- Status: New, Confirmed, Remediated
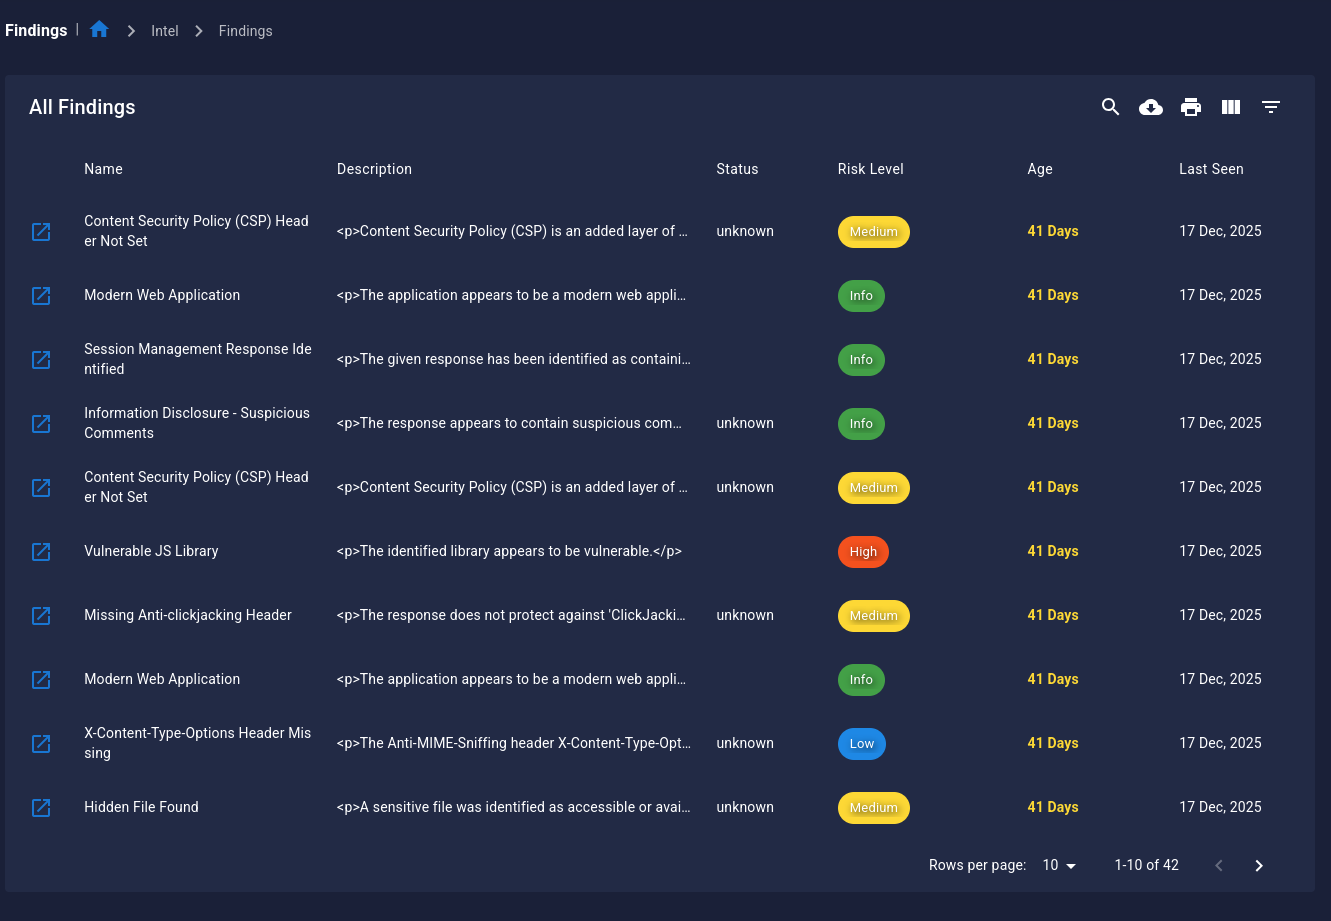
Viewing Findings
- Navigate to Attack Intelligence → Attack Findings
- Explore detailed findings including:
- Description: What was found
- Evidence: Proof of the finding
- Impact: Potential security impact
- Remediation: How to fix it
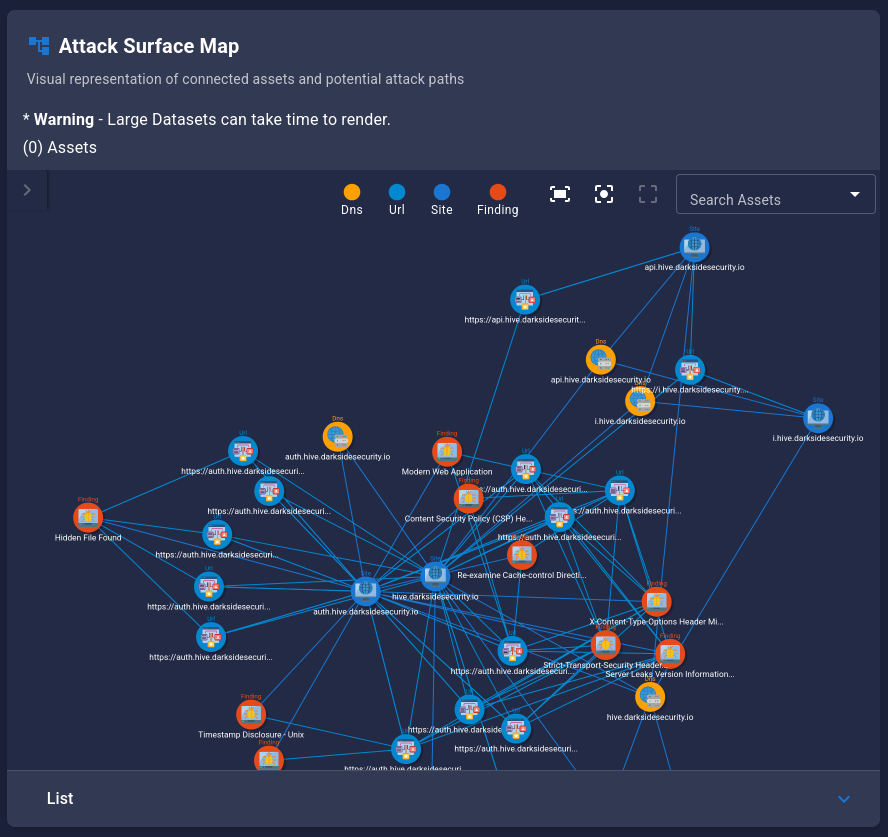
Step 9: Visualize Your Attack Surface
Hive provides powerful visualization tools to understand asset relationships.
Using the Graph Viewer
- Navigate to Assets → All
- Click the Graph View button
- Explore the interactive graph:
- Nodes: Represent assets
- Edges: Show relationships
- Colors: Indicate asset types
- Zoom/Pan: Navigate the graph
Graph Navigation
- Click and drag to pan
- Scroll to zoom
- Click a node to see details
- Double-click to expand relationships
Step 10: Generate a Report
Create professional reports for stakeholders.
Creating a Report
- Navigate to Attack Intelligence → Reporting Engine
- Click New Report
- Add Vulnerabilities from Data Tab
- Add new report elements such as Text Sections or Images
- Click Save
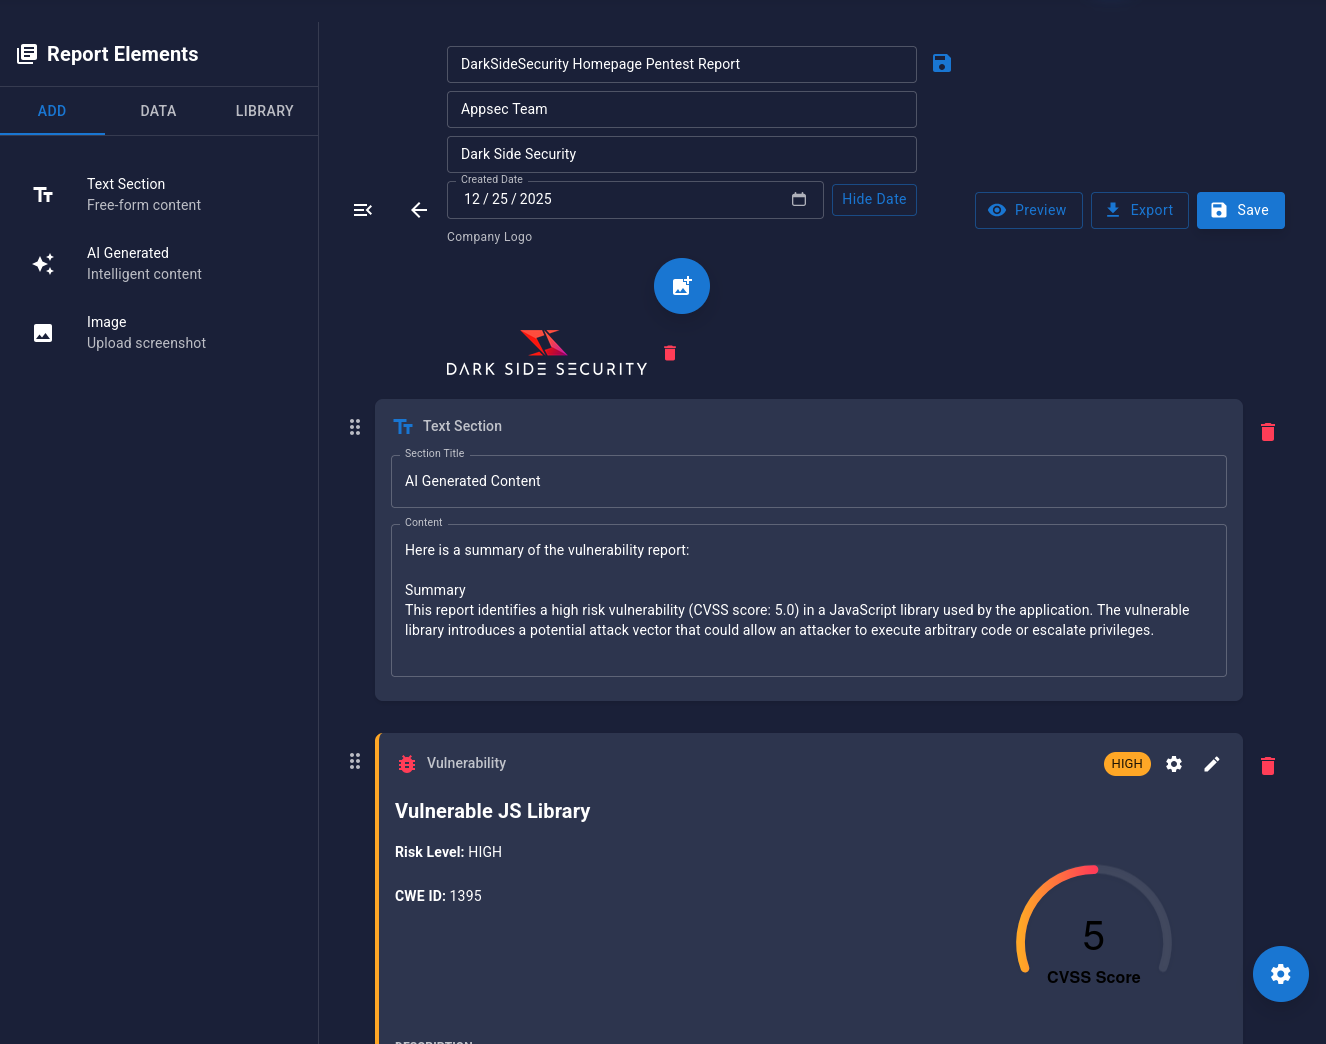
- Click Preview to see a live preview of your report.
- Click Print/PDF to export your report.
Next Steps
Congratulations! You've completed your first security scan with Hive. Here's what to explore next:
Beginner Level
- ✅ Complete first scan
- Create custom runbooks
- Explore asset types
- Understand vulnerability scoring
Intermediate Level
Advanced Level
Common First-Time Questions
How long does a typical scan take?
Scan duration varies based on scope and modules used:
- Quick scan (basic enumeration): 5-15 minutes
- Standard scan (comprehensive): 30-60 minutes
- Deep scan (extensive testing): 2-4 hours
You can monitor progress in real-time from the Scan Executions page.
Can I pause or stop a running scan?
Yes! Navigate to the scan execution and click the Stop button. You can resume later or start a new scan.
What if I don't see any results?
Common reasons:
- Scan is still running (check status)
- Target is unreachable (verify connectivity)
- Scope restrictions (check engagement scope)
- Firewall blocking (ensure Hive IPs are whitelisted)
How do I add team members?
Navigate to Configuration → Users → Invite User. Enter their email and assign appropriate roles.
Is my data secure?
Yes! All data is encrypted in transit (TLS 1.3) and at rest (AES-256). Scans run in isolated Docker containers. See our Security & Privacy section for details.
Getting Help
Need assistance?
- 📖 Search Documentation: Use the search bar above
- 💬 Community Forums: Connect with other users
- 📧 Support Email: support@darksidesecurity.io
Ready to dive deeper?